Junction Sense: Manage Continuous Queries using the Junction Dashboard
Last updated: March 6, 2026
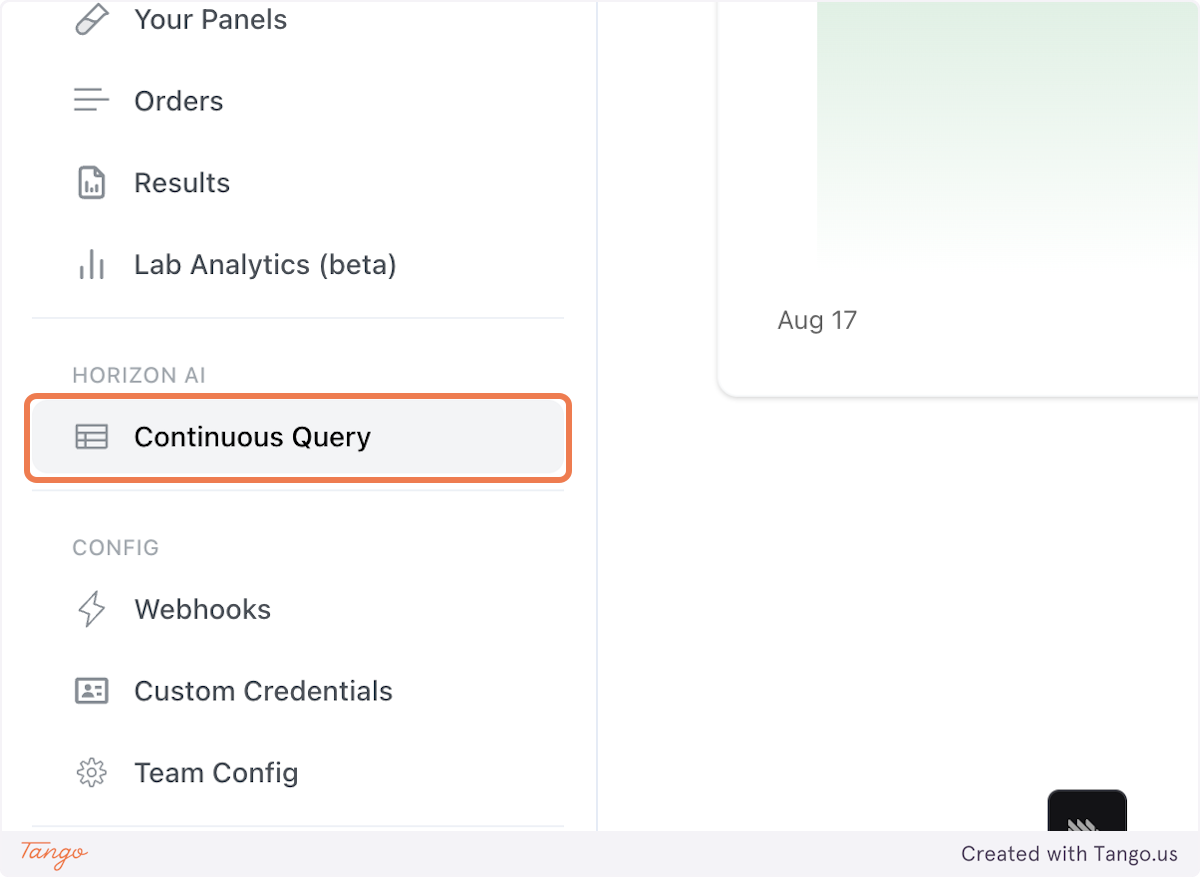
1. You can access Continuous Queries via the Junction Dashboard by clicking the sidebar tab
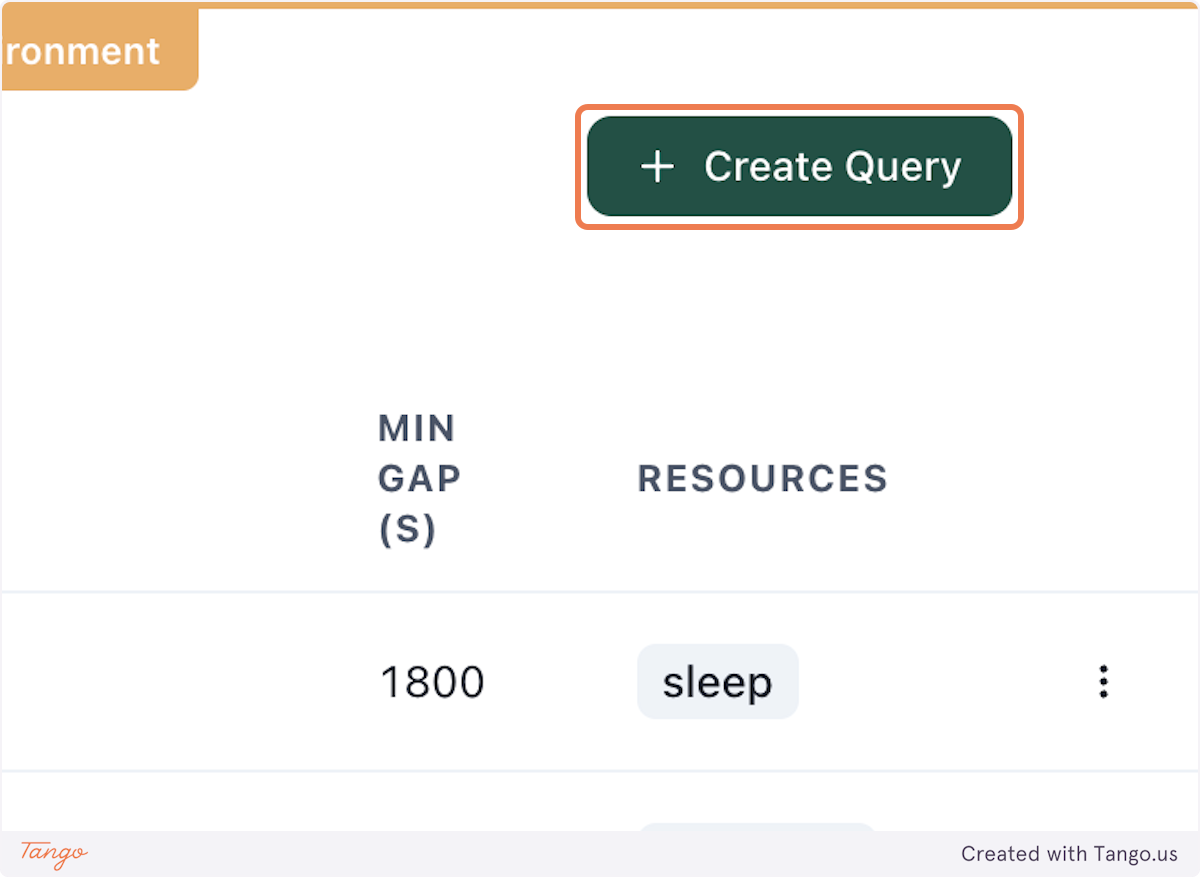
2. Create a new Query to start summarizing your data
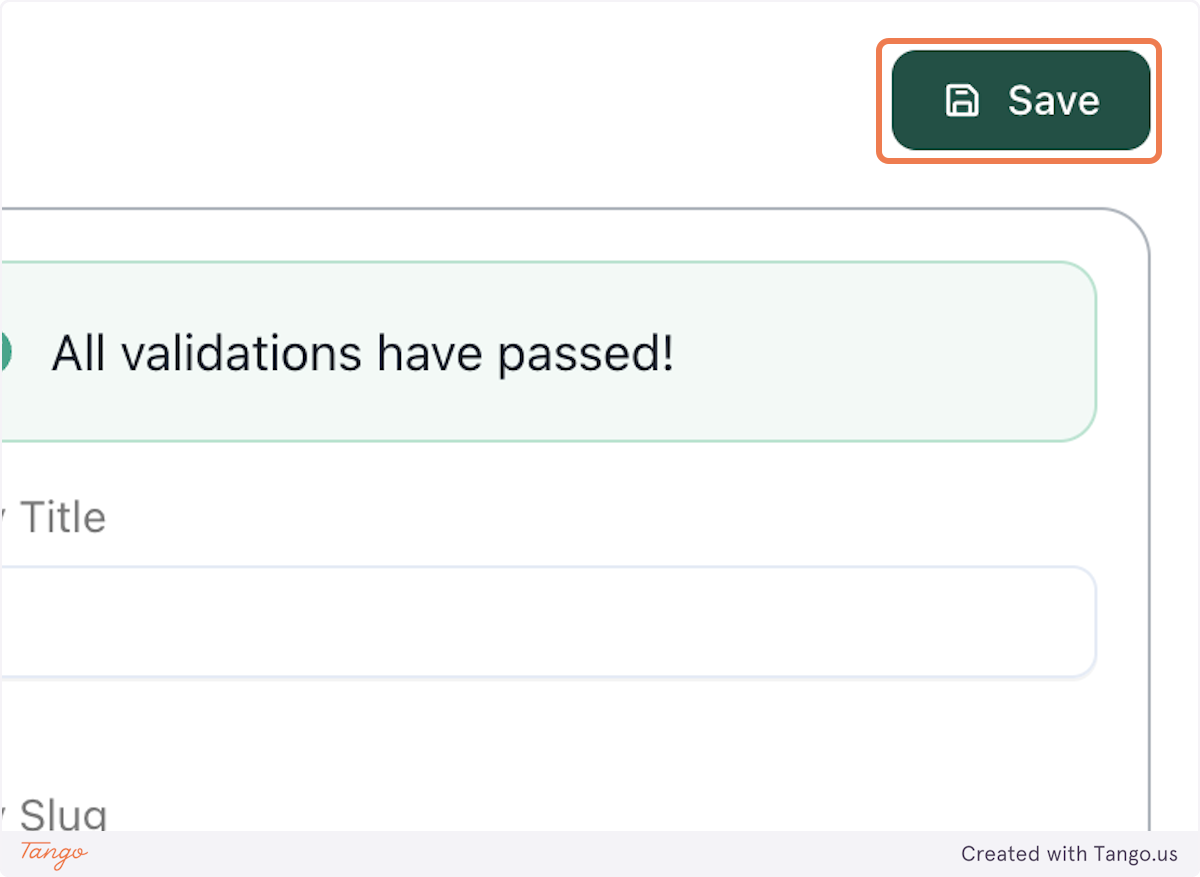
3. When you've validated your query, save it to production
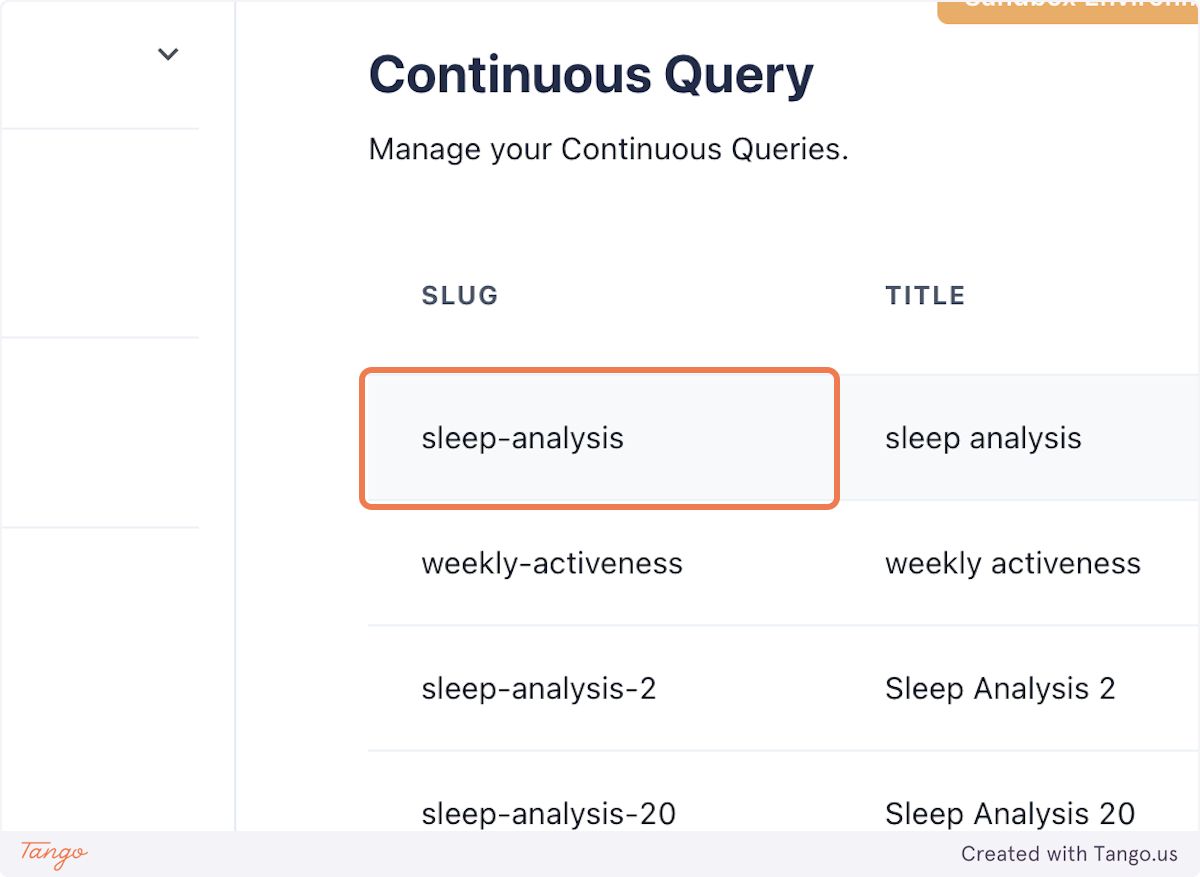
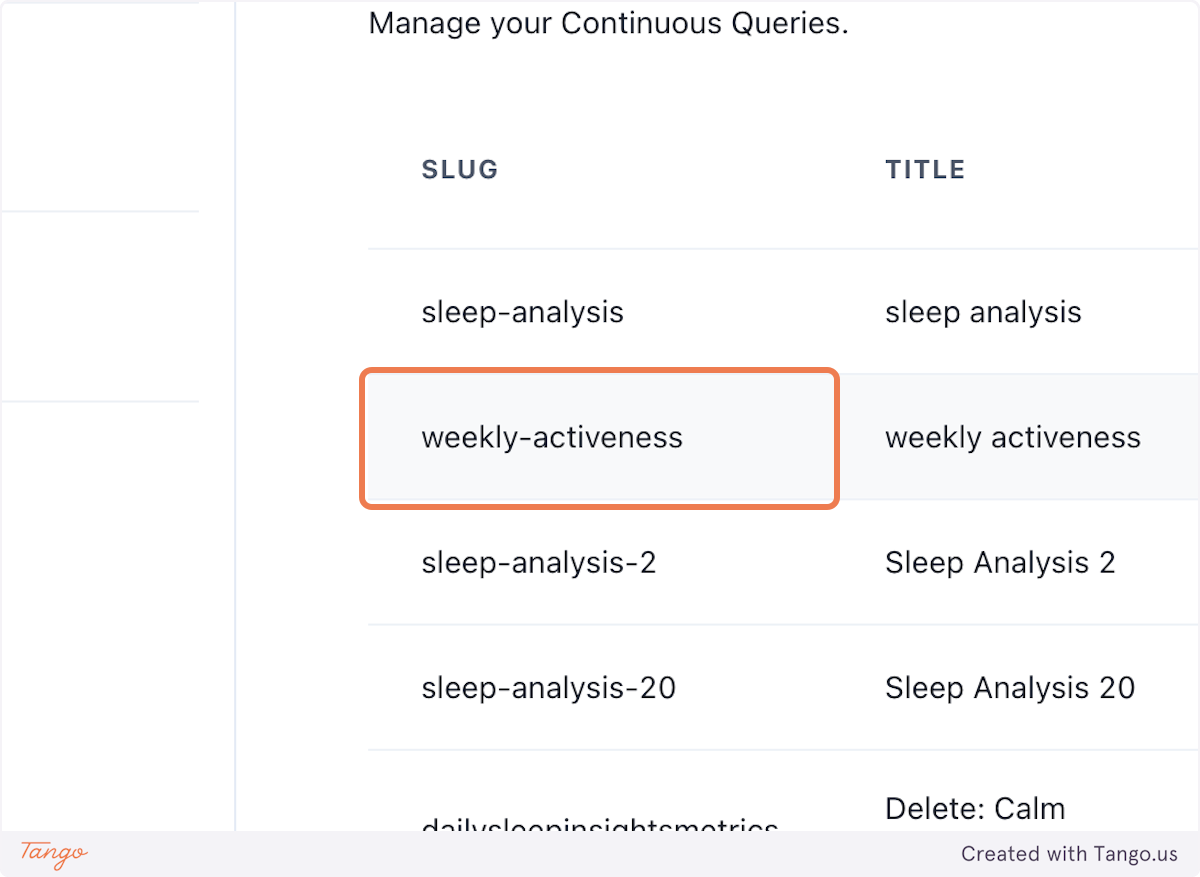
4. Manage your queries right from the dashboard.
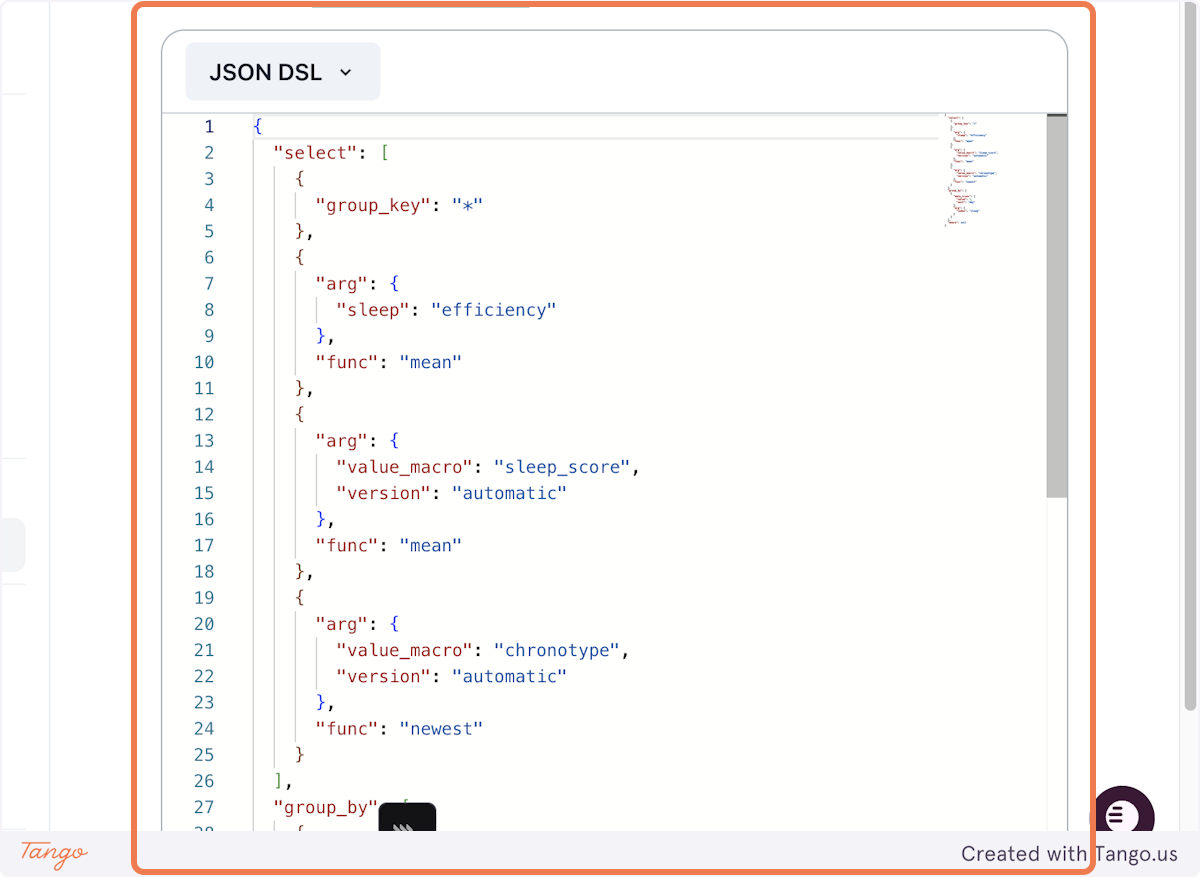
5. Click on Query Definition
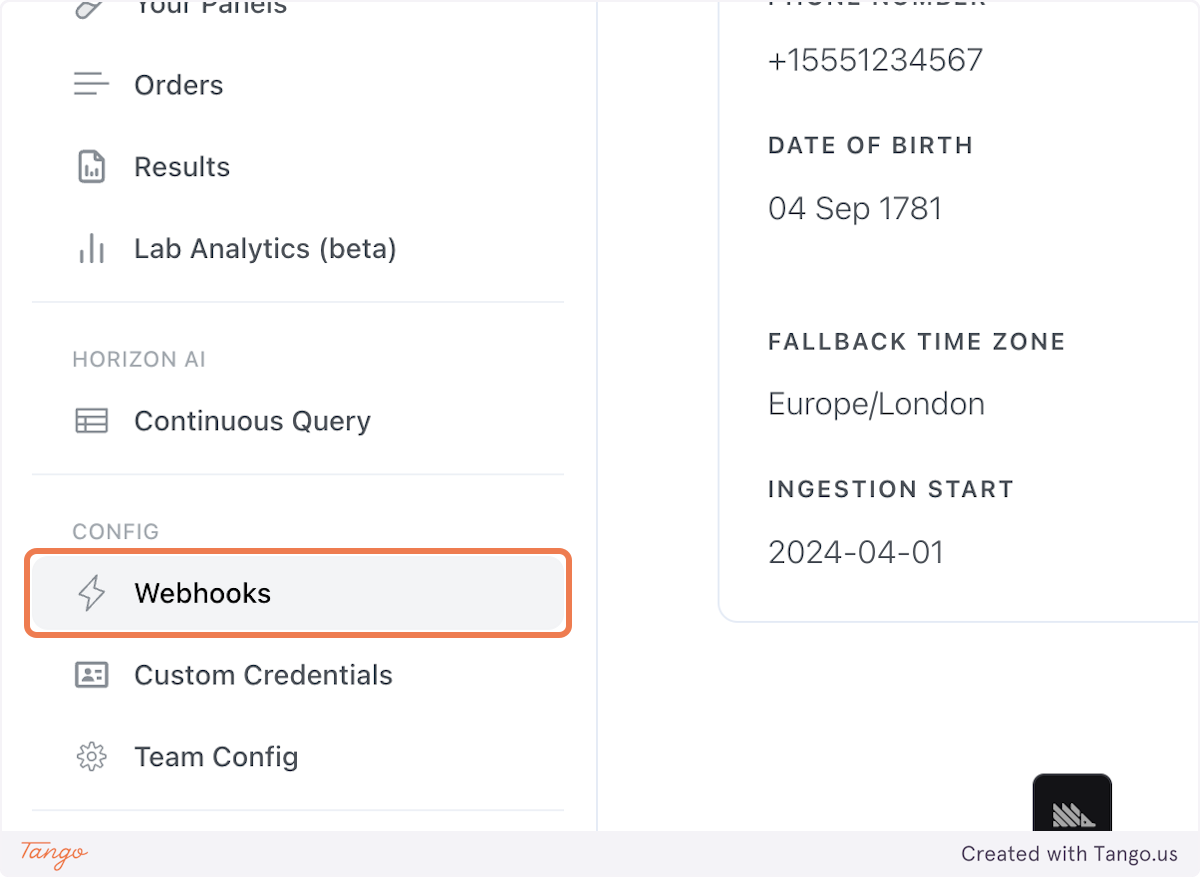
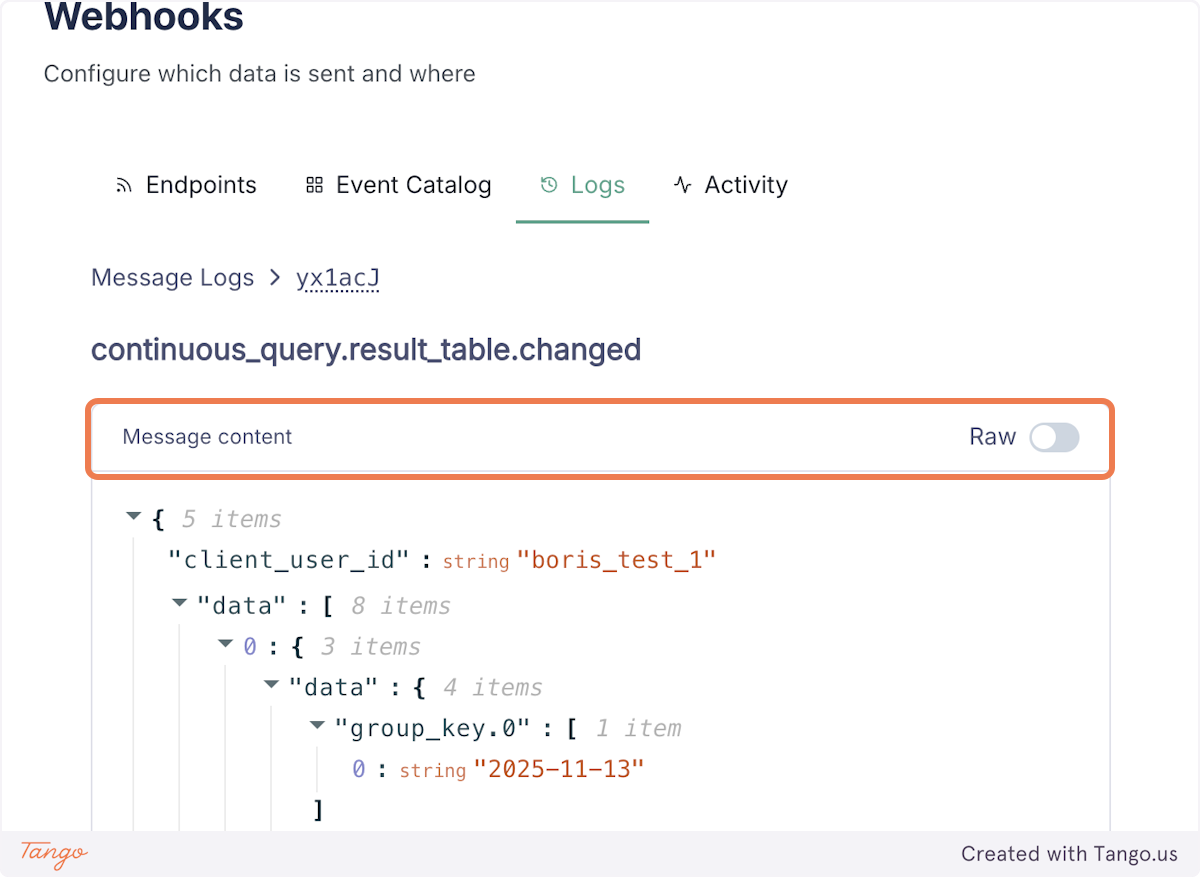
6. You can monitor your Continuous Query events in the Webhooks panel
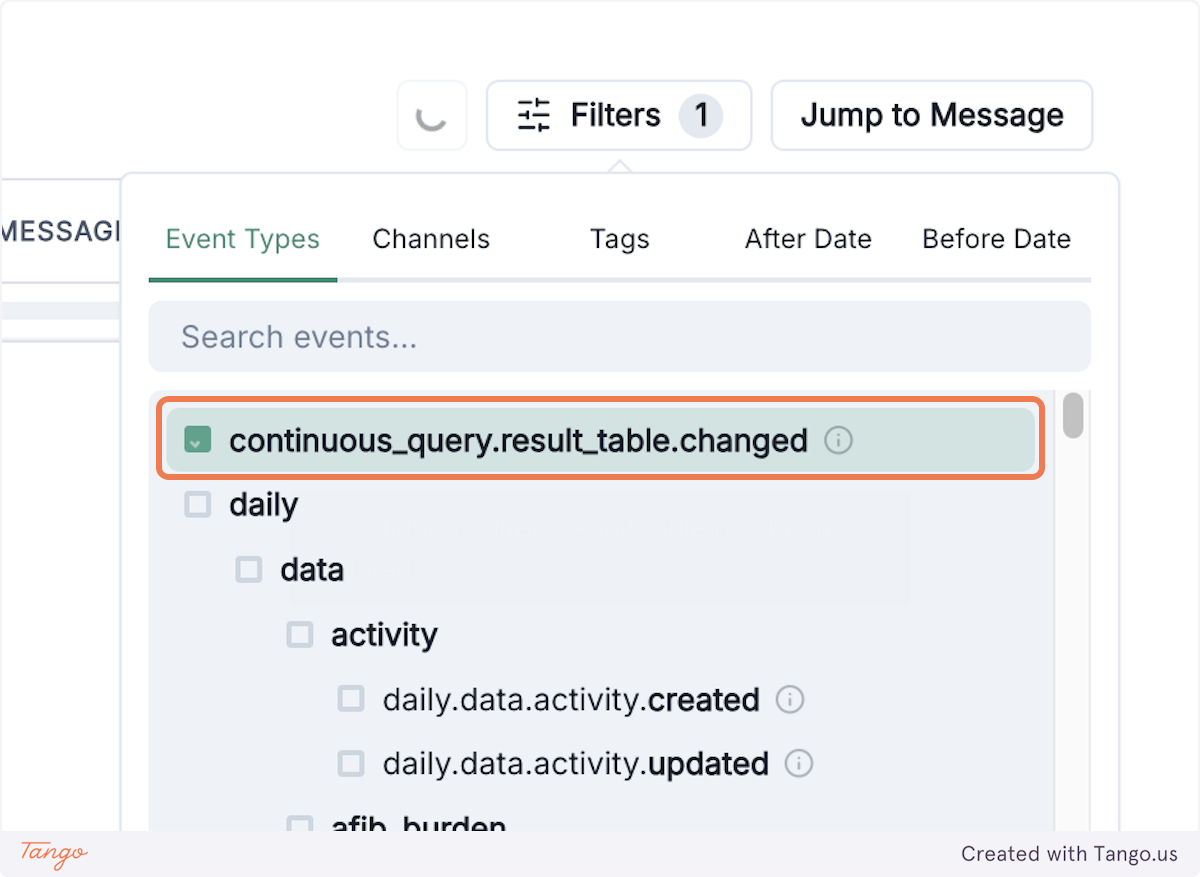
7. Detailed event logs are captured each time your query runs
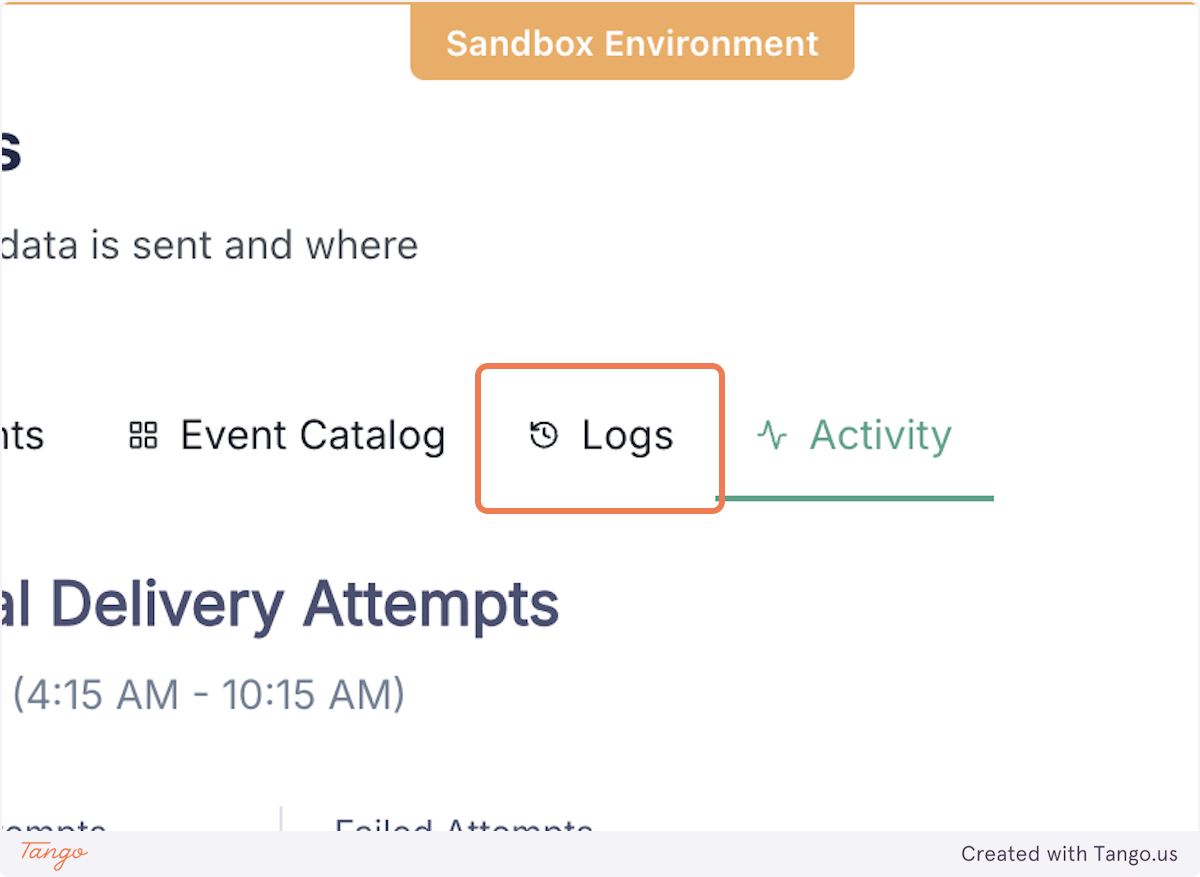
8. Access them by filtering for "continuous_query.result_table.changed"
9. You can view the event payload for each logged event by clicking "Message content"
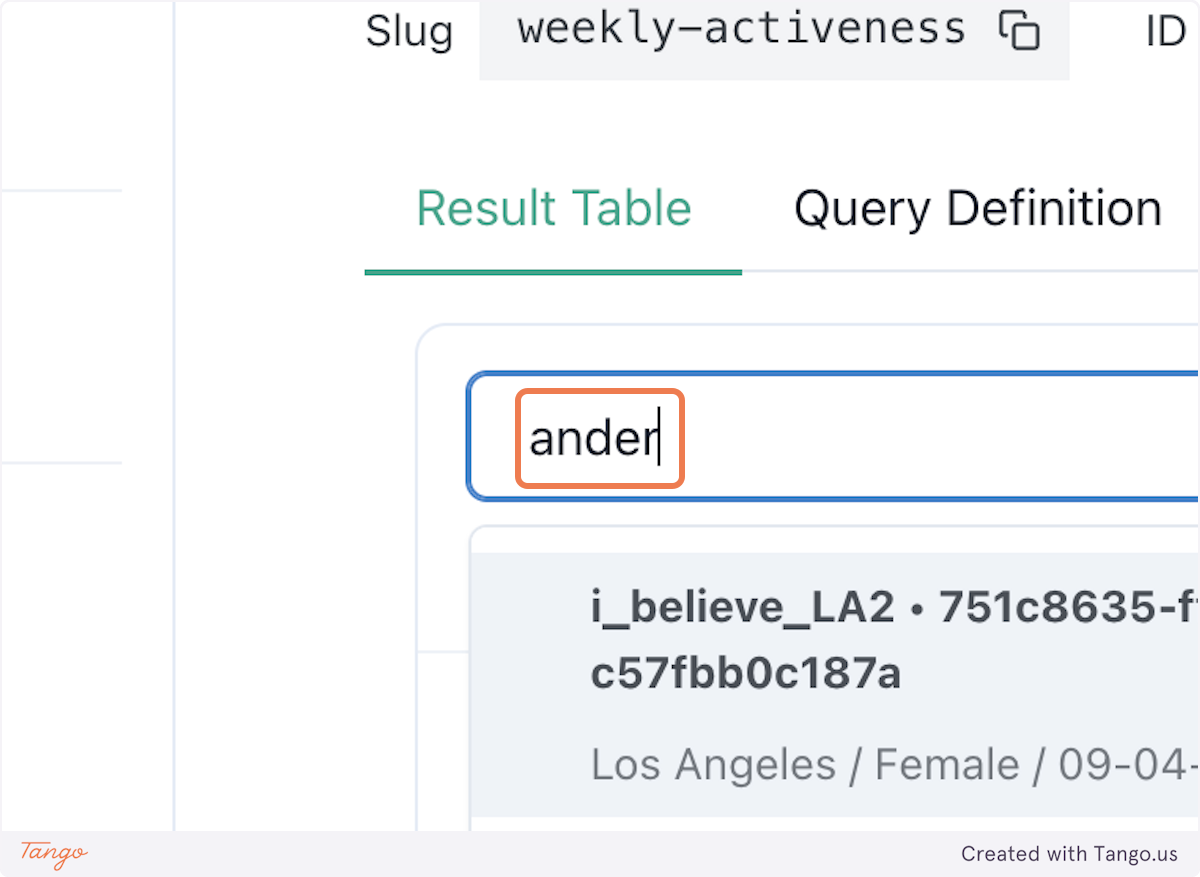
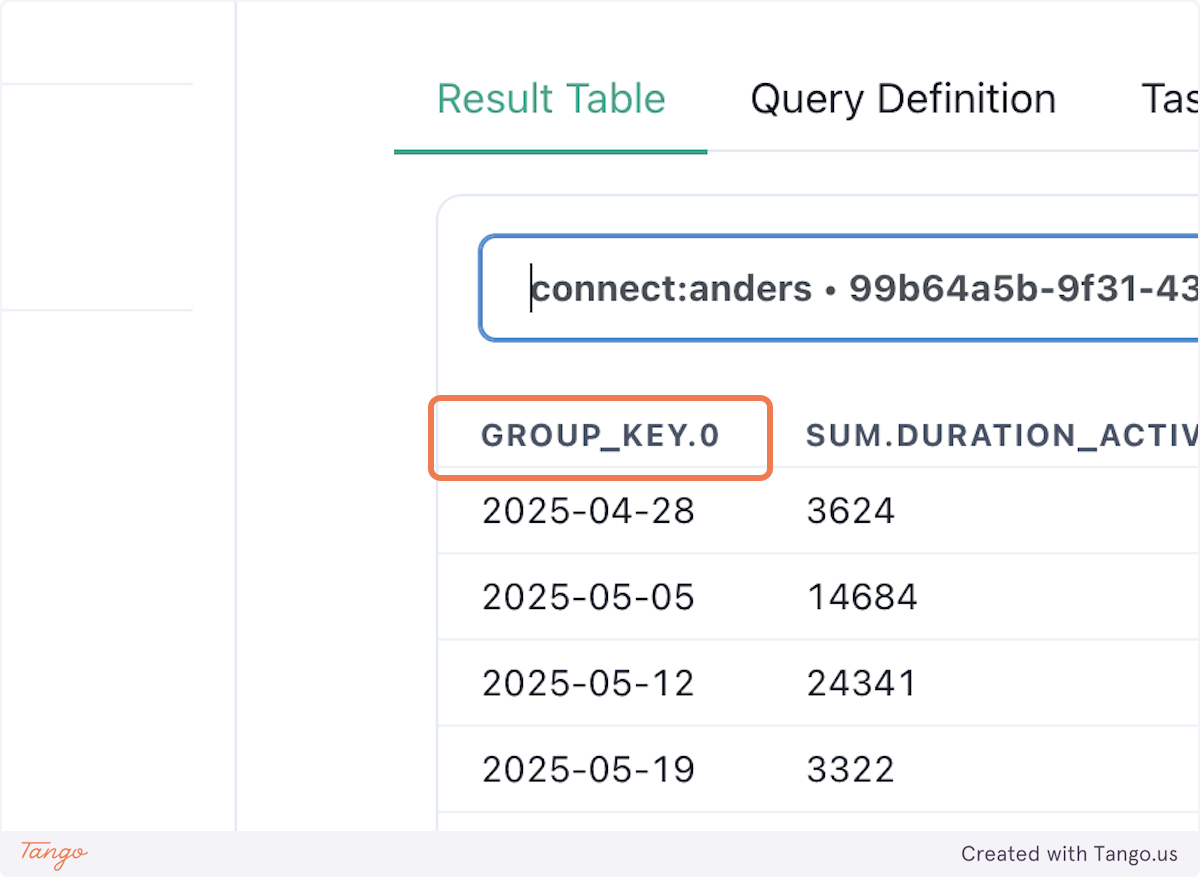
10. You can also access the tabular view of a query from the Management panel
11. Search for a user to see the tabular data for a particular Continuous Query
12. Data is indexed as defined by your Group Key (weekly, in this case)
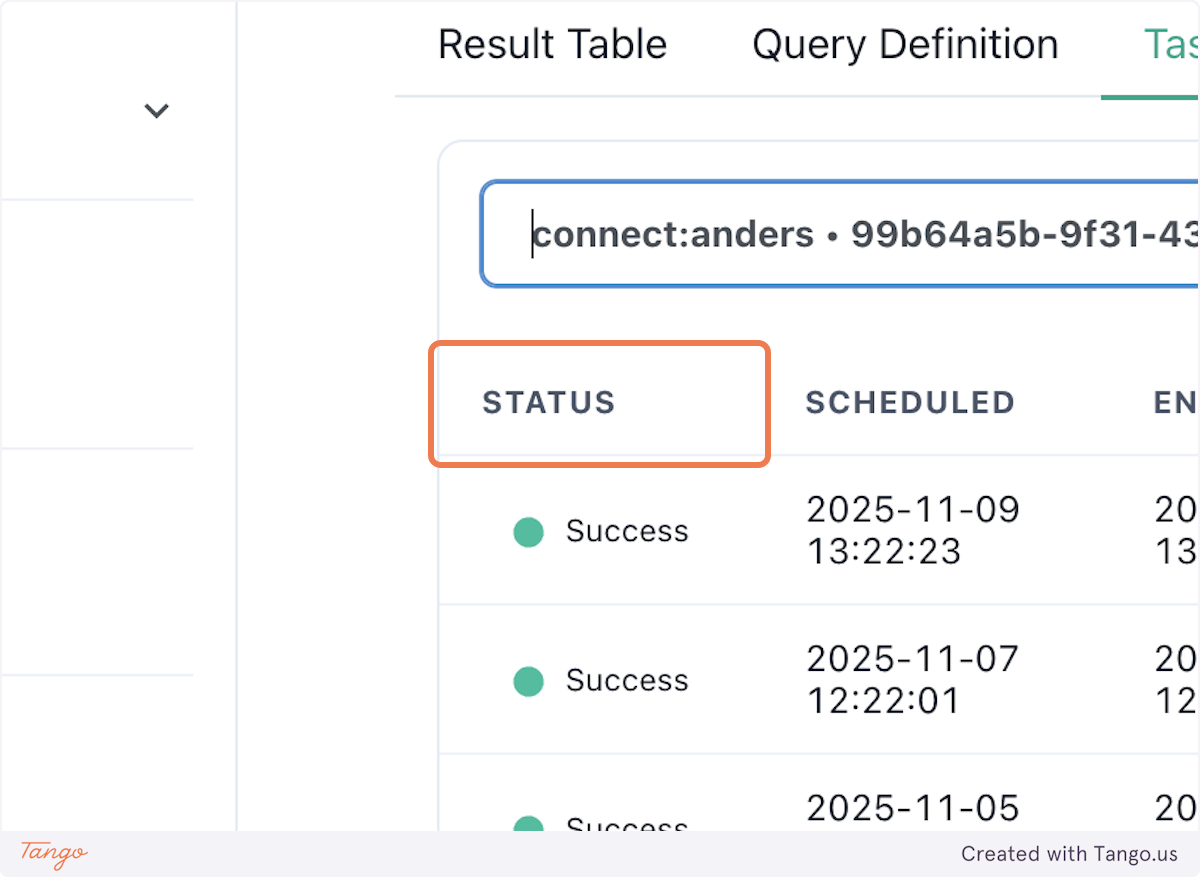
13. You can also see previous runs of this query for the selected user by accessing "Task History"
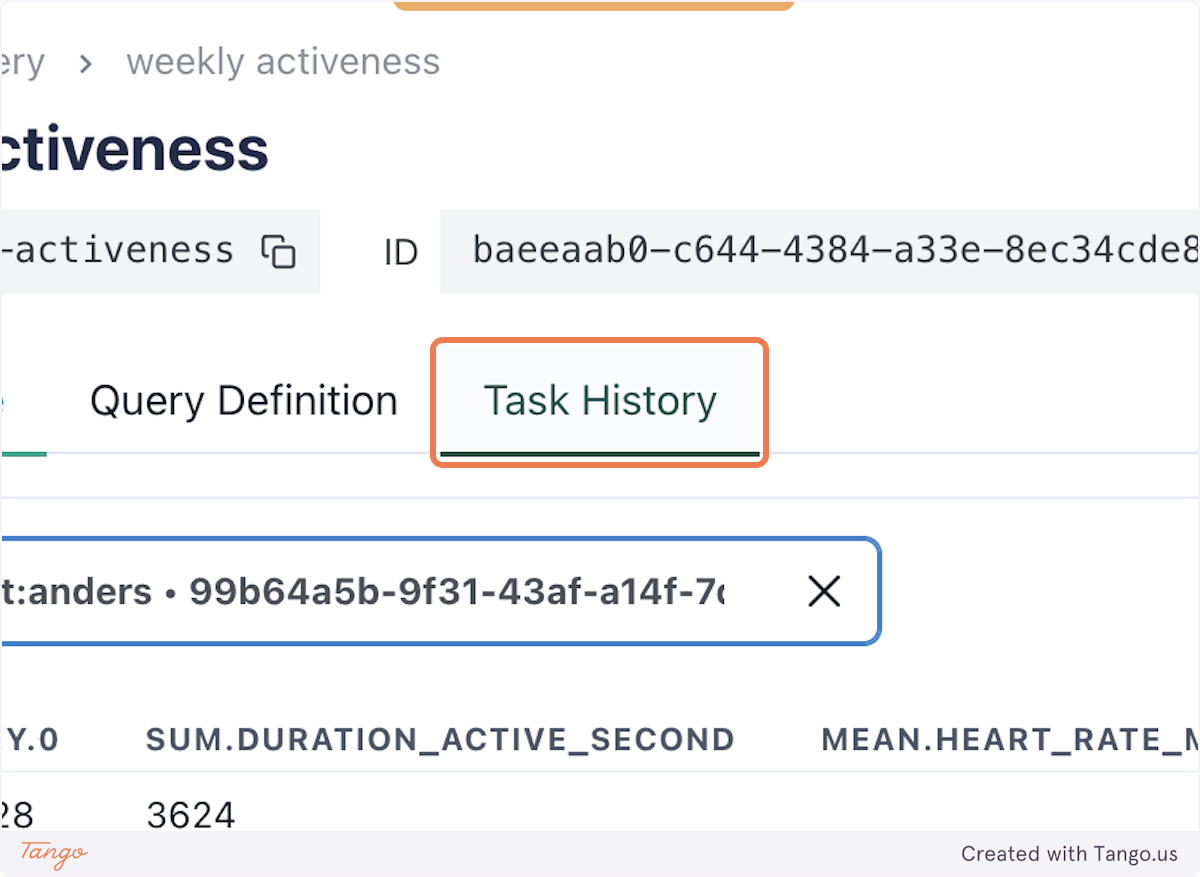
14. Each run will have an associated Status and dates